17 Maps That Will Change How You See the World
Maps tell stories that numbers can’t. The way borders bend around history, how cities cluster near water, why some regions prosper while others struggle — it’s all there if you know how to look.
Most world maps hang on classroom walls for decoration, but the right ones reshape everything you thought you understood about geography, politics, and human nature.
True Size of Countries
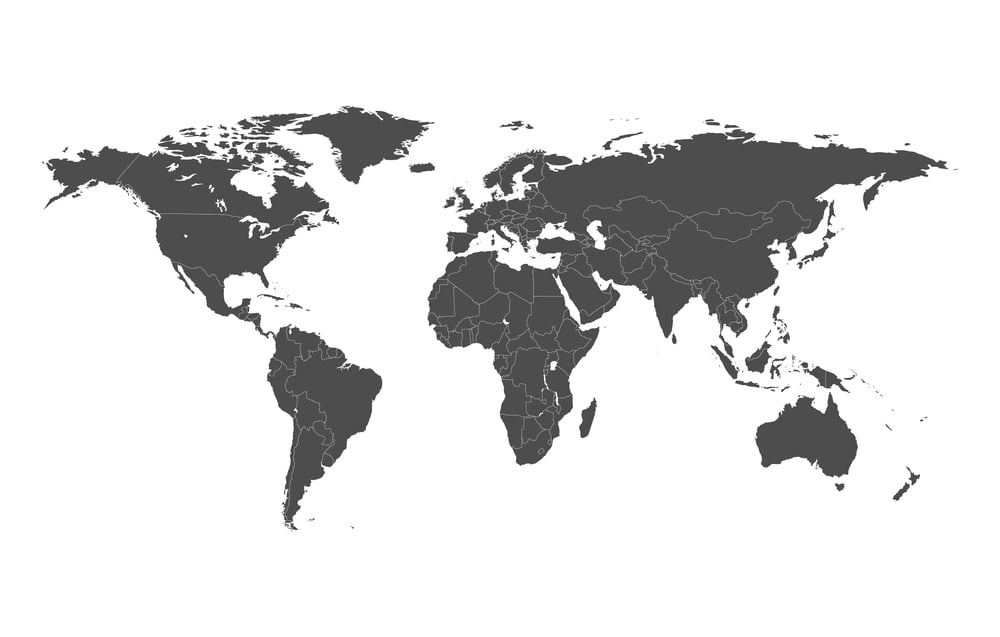
The Mercator projection has been lying to your face since elementary school. Greenland appears roughly the same size as Africa on traditional maps, but Africa is actually 11-12 times larger.
Alaska looks enormous compared to Mexico — turns out Mexico is larger. This isn’t just trivia.
When countries appear bigger or smaller than reality, it shapes how people think about global importance and power. The True Size map lets you drag countries around to see their actual dimensions.
Suddenly the world looks completely different.
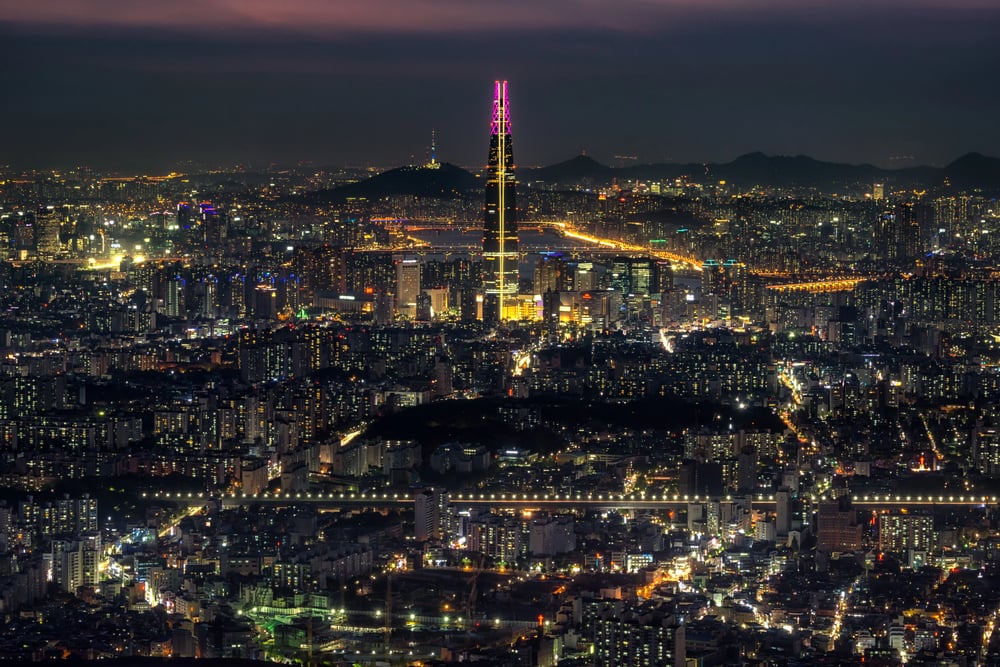
Population Density Reality

Here’s what population maps get wrong: they show where people live, not how cramped (or empty) those places actually feel, and the difference — which becomes obvious once you see density mapped properly — changes everything about how urban planning works, why some cities feel overwhelming while others with similar populations feel spacious, and why traffic patterns, housing costs, and even social behavior vary so dramatically between places that look similar on paper. So many policy decisions make no sense until you realize planners were looking at the wrong maps. And yet this is exactly what happens in city after city.
Population density mapping reveals that most of Earth is essentially empty: vast stretches where you could walk for days without seeing another human. Meanwhile, places like Bangladesh pack more people into small areas than seems physically possible, creating social and economic dynamics that can’t be understood without seeing the actual numbers laid out geographically.
Night Light Pollution
Darkness has become rare. Light pollution maps reveal just how much artificial illumination floods the night sky, but they also show something more interesting — the exact shape of modern civilization.
Economic activity glows. Wealthy regions blaze with light while poorer areas remain dark.
You can trace major highways by their steady streams of brightness cutting across otherwise black landscapes. Cities appear as brilliant spots connected by glowing threads, like neurons in a vast brain.
The maps also reveal what’s been lost. Most people in developed countries have never seen the Milky Way clearly.
The night sky that inspired countless generations of astronomers and poets has simply vanished for billions of humans.
Internet Connectivity Gaps
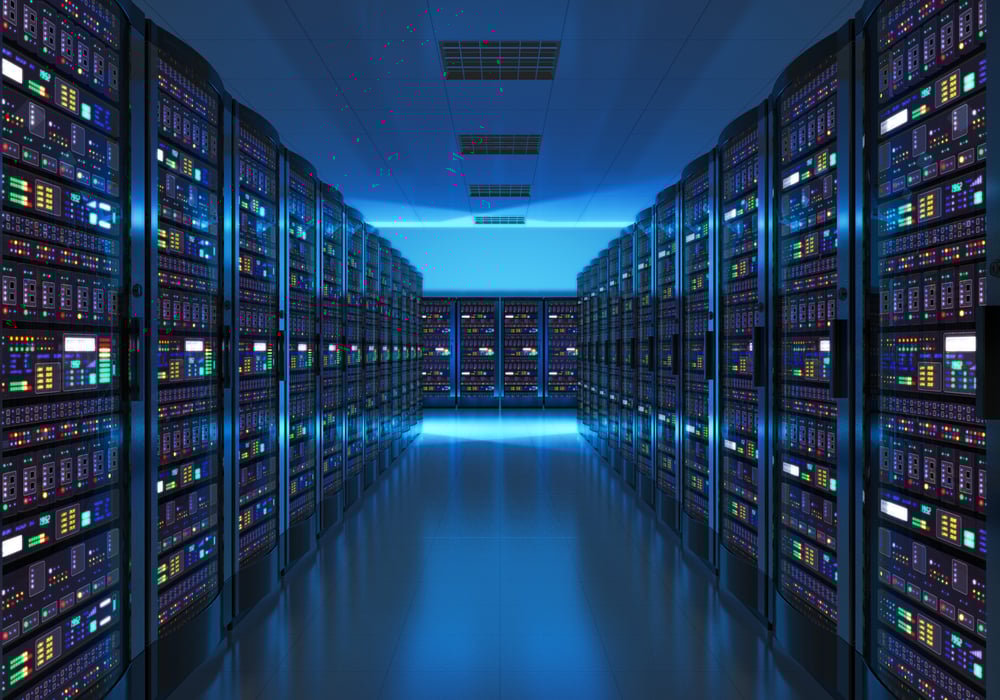
The internet feels universal until you map it properly, and the gaps — which cut across continents in patterns that mirror old colonial boundaries, economic inequality, and geographical barriers — tell the real story about who gets to participate in the digital economy and who gets left behind. Rural areas in wealthy countries often have worse connectivity than urban centers in developing nations, which makes sense once you consider the cost of running fiber optic cables across empty landscapes versus the economics of serving dense populations.
But maps reveal something planners often miss: the most disconnected regions aren’t always the most remote ones. Access to information has become the new literacy.
These maps show which populations are effectively cut off from online education, remote work opportunities, and digital services that others take for granted. The digital divide isn’t just about having a smartphone — it’s about reliable, fast connections that make modern economic participation possible.
Global Migration Flows

Migration flows trace invisible rivers across continents, carrying millions of people from places where opportunity has dried up to regions where it still flows freely. These currents shift like weather patterns — sometimes gradually, sometimes in sudden floods triggered by war, economic collapse, or climate disasters.
The maps reveal that most migration isn’t random desperation. People move along established routes, following family connections, language ties, or historical relationships between countries.
Mexican workers head north to the United States, while Romanian workers flow west to Germany and the UK. These aren’t accidents — they’re the predictable result of economic pressure finding the path of least resistance.
What looks like chaos on the evening news becomes comprehensible when viewed from above. Migration flows follow logic, even when the individual decisions feel desperate or impossible.
Climate Change Projections
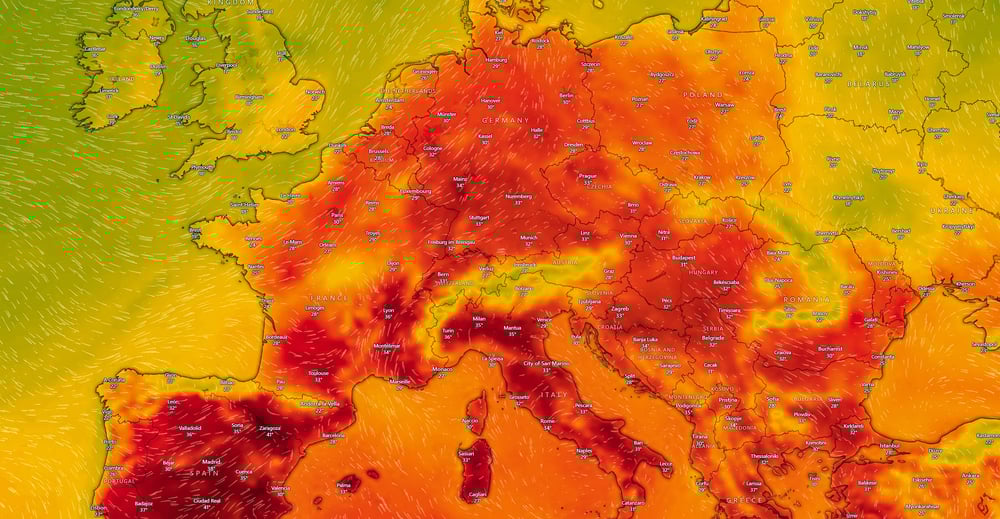
Climate maps don’t just predict weather — they forecast the future shape of human civilization, and the changes coming over the next 50 years will redraw coastlines, shift agricultural zones, and make some of the world’s largest cities barely habitable while turning previously frozen regions into prime real estate. Miami’s downtown will be underwater during high tides.
Phoenix will become too hot for outdoor work during summer months. But northern Canada and Siberia will bloom with new possibilities.
The maps force an uncomfortable question: should we be investing in seawalls or planning managed retreats? Agricultural zones will migrate toward the poles, leaving behind millions of farmers whose families have worked the same land for generations.
Wine regions that have defined entire cultures for centuries will become too warm for their traditional grapes, while new wine regions emerge in places that are currently considered too cold.
Language Distribution

Languages cluster in patterns that reveal the hidden geography of human culture. Spanish flows across vast territories connected by colonial history, while Arabic creates an unbroken belt from Morocco to Iraq, interrupted only by Israel’s Hebrew-speaking island in the middle.
But the really interesting stories appear in the borderlands where languages meet. Switzerland’s linguistic boundaries don’t follow its political ones — they reflect centuries of trade, migration, and cultural exchange.
India contains more language diversity than entire continents, with dozens of major languages and hundreds of dialects compressed into a single nation. Indigenous languages appear on these maps as tiny dots, often surrounded by vast expanses of colonial tongues.
Each dot represents thousands of years of unique human knowledge that could disappear within a generation.
Economic Inequality by Region

Wealth doesn’t spread evenly, even within countries that seem prosperous from the outside, and the internal economic maps of places like the United States, Brazil, or India reveal patterns of inequality so extreme they resemble different countries entirely — which, in many practical ways, they are. Silicon Valley’s per capita income rivals that of the wealthiest European nations, while parts of Mississippi or Alabama show economic indicators closer to developing countries.
So the “average” American income becomes meaningless when the range spans from third-world poverty to unprecedented wealth within the same political boundaries. And this explains why national politics often feel like conversations between people living in completely different realities.
These internal borders matter more than international ones for understanding how people actually live. A software engineer in Bangalore might have more in common economically with someone in Seattle than with a farmer 200 miles away in rural Karnataka.
Food Security Patterns

Hunger isn’t about scarcity — it’s about distribution, and food security maps reveal the cruel irony of modern agriculture: the regions that produce the most food often have the highest rates of malnutrition while wealthy areas that grow nothing import exotic ingredients from around the globe. Farmers in cash-crop regions export their harvests for foreign currency and can’t afford to feed their own families properly. It’s market efficiency that creates human suffering.
The maps also show how vulnerable the global food system has become. A handful of regions produce the majority of staple grains, making everyone dependent on weather patterns, political stability, and trade relationships in places most people couldn’t locate on a map.
Climate change will make this worse. The most food-insecure regions are also the most vulnerable to droughts, floods, and extreme weather that will disrupt harvests just when growing populations need them most.
Water Scarcity Reality

Fresh water flows in patterns that don’t respect political boundaries, creating conflicts that maps predict decades before they explode into headlines, and the countries drawing from shared aquifers or river systems will either learn to cooperate or fight — there’s no middle ground when the wells run dry. The Colorado River supports 40 million people across seven U.S. states and Mexico, but climate change and overuse mean it no longer reaches the ocean most years. Every gallon used in Denver is a gallon that won’t reach Los Angeles or Tijuana. The math doesn’t work, and maps show exactly where the tensions will be highest.
Underground water reserves took thousands of years to accumulate, but modern agriculture drains them faster than rain can refill them. The Ogallala Aquifer beneath the Great Plains has dropped hundreds of feet in some areas, turning productive farmland back into the desert it was before irrigation made it bloom.
Some of the world’s largest cities sit in water-stressed regions, betting their futures on engineering solutions or imports from increasingly distant sources. That’s not sustainable, and the maps show which cities will face a crisis first.
Religious Geographic Patterns

Religious boundaries rarely follow neat political lines, creating layers of identity that complicate every conflict and alliance in ways that purely secular analysis misses entirely. The Islamic world stretches across multiple continents but fragments along sectarian lines that are invisible on political maps yet crucial for understanding everything from trade relationships to military conflicts.
Christianity’s global spread reflects colonial history, with Catholic regions mapping onto Spanish and Portuguese influence while Protestant areas track British and Dutch expansion. But local variations create unique hybrid traditions that don’t fit standard categories.
The most interesting patterns appear where different religions meet. These border zones often become centers of either remarkable tolerance or intense conflict, depending on historical accidents and political leadership.
Transportation Network Reality
Roads and railways create the nervous system of modern civilization, but most people only see the small section they travel regularly — never the larger patterns that determine which regions prosper and which ones get left behind. Transportation maps reveal that economic development follows infrastructure, not the other way around.
Cities grow at the intersections of major routes while equally suitable locations without good connections remain small towns. The gaps matter more than the connections.
Regions without reliable transportation to major markets stay poor regardless of their natural resources or human potential. Africa’s economic struggles make more sense when you see how few roads and railways connect its regions compared to Europe or North America.
Maritime shipping routes carry most global trade, but they’re invisible unless you map them. A few dozen ports handle the majority of world commerce, creating chokepoints that could paralyze the global economy if disrupted.
Energy Production vs Consumption
Energy flows reveal the hidden dependencies that shape international relations, and the countries that produce oil, gas, and electricity rarely use most of it themselves — they export it to regions that consume far more than they generate, creating relationships of dependence that explain everything from military alliances to economic sanctions. Germany burns Russian gas to power factories that build cars sold to China, which uses coal-fired electricity to manufacture solar panels exported to California.
The web of energy relationships connects every country whether they realize it or not. The maps also show how vulnerable modern life has become to supply disruptions.
A single pipeline explosion or shipping delay can trigger energy crises thousands of miles away, causing blackouts, economic recession, and political instability in places that seemed completely secure. Renewable energy is changing these patterns, but slowly.
Solar and wind resources are distributed differently than fossil fuels, which will eventually reshape global power relationships in ways most people haven’t considered.
Disease Transmission Routes

Diseases follow transportation networks just like trade goods, spreading along the same routes that connect cities and cross borders, and modern air travel has compressed what used to be months-long plague journeys into hours-long pandemic launches — which is why health officials now track flight patterns as carefully as they monitor symptoms. A respiratory illness that emerges in a major international hub can reach every continent within days, while similar outbreaks in isolated regions might take months to spread beyond their local area.
The maps of disease transmission reveal which cities and countries are most vulnerable based purely on their connectivity to global transportation networks. Major airline hubs become epicenters not because they’re less sanitary, but because they’re more connected.
Climate change is shifting the geographical ranges of disease-carrying insects and animals, redrawing the maps of risk for malaria, dengue fever, and other vector-borne illnesses that had been contained to tropical regions.
Natural Disaster Risk Zones
Natural disasters aren’t natural surprises — they’re predictable events that happen in the same places repeatedly, yet millions of people continue building homes and businesses in flood plains, earthquake zones, and hurricane paths as if geography doesn’t matter. The maps show exactly which areas face the highest risks, but real estate development ignores them in favor of short-term profits.
Coastal cities keep expanding into areas that flood during every major storm. California keeps approving housing developments in fire-prone canyons.
Insurance companies use these maps to set rates, creating a market signal that should discourage risky development. Instead, government disaster relief subsidizes poor location choices, encouraging more people to build in dangerous areas.
The patterns are getting worse as climate change intensifies storms, extends drought periods, and raises sea levels. What used to be 100-year floods now happen every few years, but the maps showing increased risk don’t match the maps showing new development.
Urban Growth Projections

Cities grow in predictable patterns that planners can map decades in advance, but most places ignore their own projections and end up with infrastructure shortages, traffic nightmares, and housing crises that could have been prevented with earlier action, which happens because short electoral cycles create incentives to avoid expensive long-term investments even when the maps clearly show they’ll be necessary. Lagos will have 25 million people by 2050, but its current infrastructure can barely handle its existing population.
The same pattern repeats across dozens of rapidly growing cities in Africa and Asia. The fastest urban growth is happening in regions with the least resources to manage it properly.
These cities will either find innovative solutions to provide housing, transportation, and utilities for millions of new residents, or they’ll become centers of poverty and instability that affect global migration patterns. Some cities are shrinking instead of growing, creating different but equally serious challenges.
Detroit, Cleveland, and dozens of post-industrial cities have lost hundreds of thousands of residents, leaving behind oversized infrastructure systems that are expensive to maintain for smaller populations.
Time Zone Economic Effects

Time zones shape global business in ways that create subtle but persistent advantages for cities positioned in the right slots relative to major markets, and London’s dominance in international finance stems partly from its ability to overlap with both Asian markets in the morning and American markets in the afternoon — a geographical accident that became a trillion-dollar advantage. New York and London can communicate during regular business hours while also reaching Tokyo or Hong Kong during acceptable calling times.
The maps show why certain cities become natural headquarters for international operations while others remain regional centers despite having similar resources and infrastructure. Sydney struggles to coordinate with global markets because its time zone puts it out of sync with both America and Europe.
Remote work is changing these patterns slightly, but most businesses still require real-time communication during overlapping hours. Video calls at 3 AM work occasionally, but they can’t become the foundation of daily operations.
Seeing Patterns, Not Just Places

Maps have always been political documents disguised as neutral information. Every projection, every color choice, every decision about what to include or leave out reflects someone’s priorities and assumptions about what matters.
The 17 maps in this collection strip away different layers of those assumptions. They reveal patterns that remain invisible when you focus on individual countries or cities instead of global systems.
Human migration, economic flows, and environmental changes don’t respect political boundaries — they follow their own logic across continents and decades. Understanding these patterns changes how you read the news, evaluate policy proposals, and think about where to live or invest.
Geography isn’t destiny, but it’s the foundation that everything else builds on. The maps just help you see the foundation clearly.
More from Go2Tutors!

- The Romanov Crown Jewels and Their Tragic Fate
- 13 Historical Mysteries That Science Still Can’t Solve
- Famous Hoaxes That Fooled the World for Years
- 15 Child Stars with Tragic Adult Lives
- 16 Famous Jewelry Pieces in History
Like Go2Tutors’s content? Follow us on MSN.