Everyday Measurements People Misunderstand
You probably measure things every day without thinking twice. Temperature on the thermostat.
Water for coffee. How much sleep you got last night.
These feel automatic, like breathing. But most of these measurements don’t mean what you think they mean.
The numbers on the scale, the marks on the measuring cup, even the digits on your thermometer—they tell a different story than the one you’ve been reading.
Room Temperature Isn’t Standard
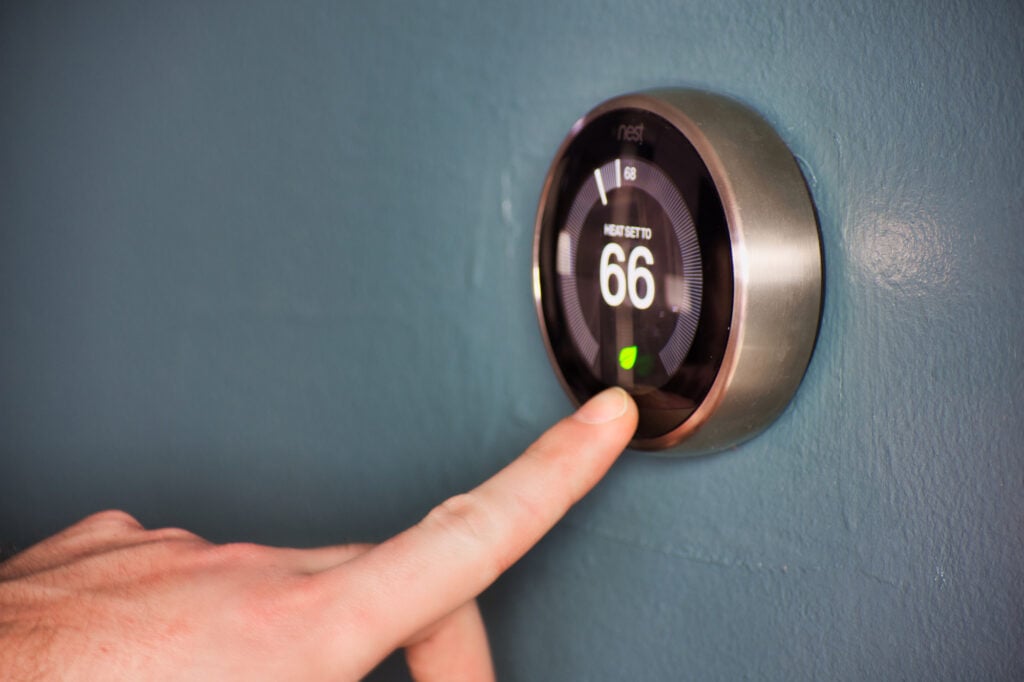
When someone says room temperature, you probably picture the same number everyone else does. Except you don’t.
Room temperature ranges anywhere from 68 to 77 degrees Fahrenheit depending on who you ask and where you live. Scientists use 68 to 72 degrees for lab work.
The World Health Organization suggests 64 degrees for healthy adults. Your grandmother keeps her house at 78 and considers that perfectly reasonable.
The confusion gets worse when recipes call for room temperature ingredients. That butter sitting on your counter reaches different temperatures based on the season, your home’s insulation, and whether you live in Phoenix or Portland.
Serving Sizes Bear No Relation to How People Eat

Pick up any food package and check the serving size. Now look at how much you actually eat.
The numbers rarely match. A serving of ice cream is half a cup.
Half a cup. Nobody eats half a cup of ice cream and puts the container back.
A serving of pasta is two ounces dry, which cooks up to roughly one cup. That’s an appetizer, not dinner.
Companies set these serving sizes to make nutritional information look better. They follow FDA guidelines that were established decades ago and never updated to reflect actual eating habits.
So when you read that a bag of chips contains “only 150 calories per serving” and that bag contains 2.5 servings, you’ve already eaten 375 calories before you notice.
Blood Pressure Numbers Create False Security
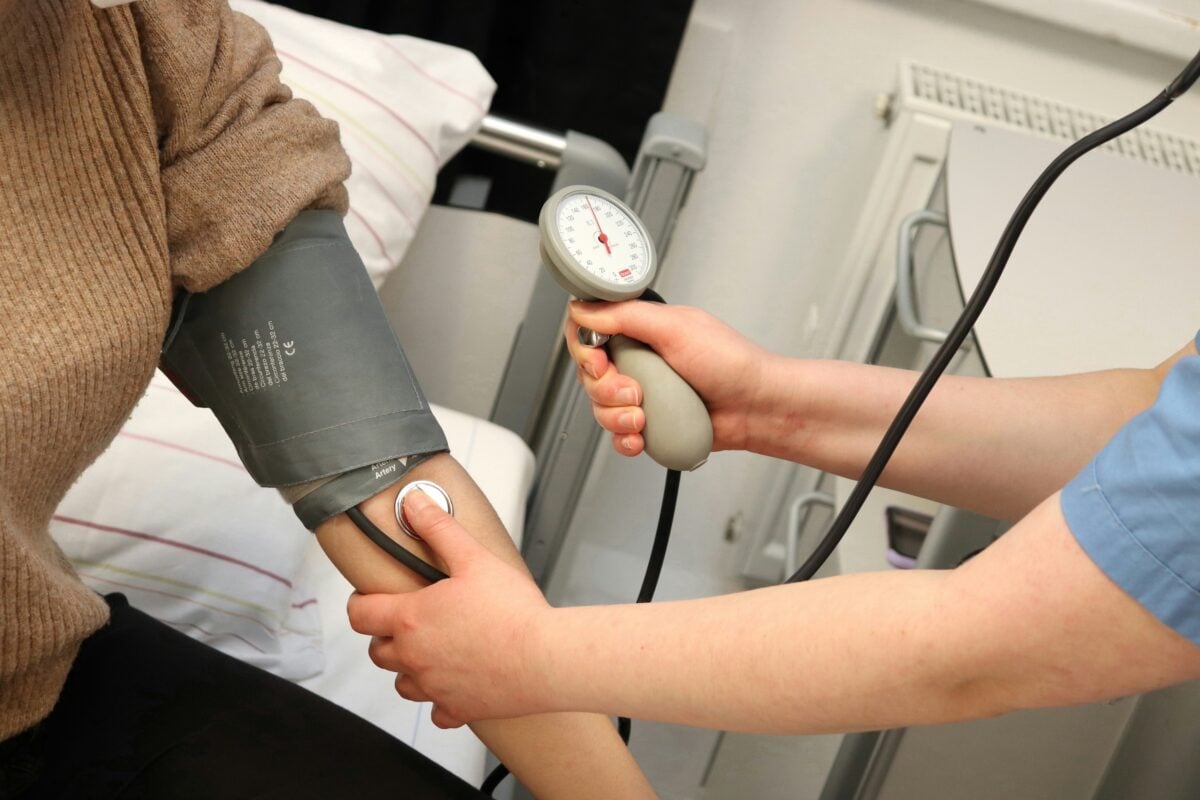
The doctor tells you your blood pressure is 120 over 80 and you feel reassured. Normal, right?
But blood pressure changes constantly throughout the day. It spikes when you’re stressed, drops when you’re relaxed, rises after coffee, and fluctuates based on how you’re sitting and whether you just climbed stairs.
That single reading at the doctor’s office captures one moment in time, heavily influenced by the anxiety of being at a doctor’s office in the first place. Even more confusing, what counts as normal has changed.
The threshold for high blood pressure was lowered in 2017 from 140/90 to 130/80, which suddenly made millions more people hypertensive overnight. The blood didn’t change.
The measurement standard did.
Body Temperature of 98.6 Is a Myth

Everyone knows normal body temperature is 98.6 degrees Fahrenheit. Except that’s wrong.
That number came from a German doctor in 1851 who averaged thousands of armpit temperatures. Modern research shows normal temperature ranges from 97 to 99 degrees, depending on the time of day, your age, what you’ve been doing, and where you take the measurement.
Your temperature is lower in the morning, higher in the evening. It’s different under your tongue versus in your ear versus on your forehead. Athletes run cooler. Women’s temperatures shift with their menstrual cycles.
That 98.6 number is so ingrained that people panic over 99 degrees when that’s perfectly normal for many people at many times.
Cup Measurements Vary by Country
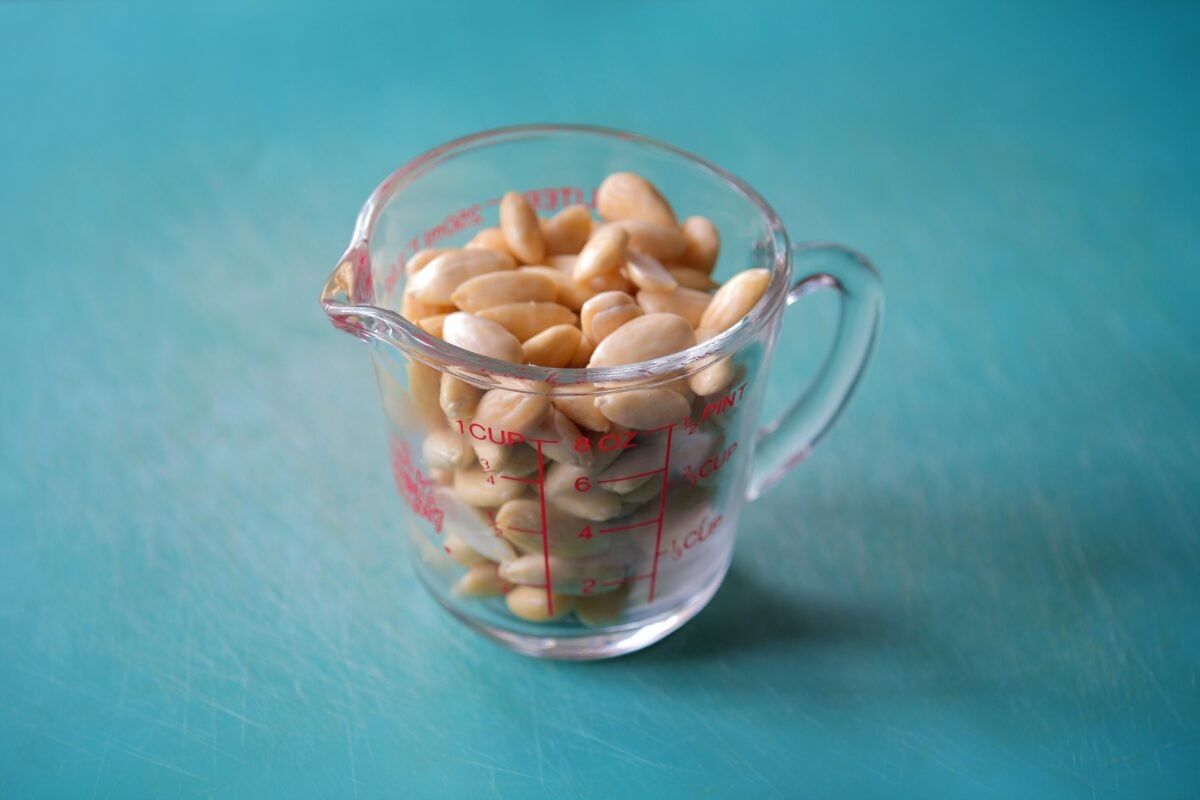
A cup isn’t a universal measure, which makes following international recipes treacherous. In the United States, a cup equals 240 milliliters.
In Canada, it’s 227 milliliters. In the UK, there’s no standard cup measurement at all because they use weight.
In Japan, a cup is 200 milliliters. Australia uses 250 milliliters.
Baking recipes suffer most from this confusion. That extra or missing 10 to 50 milliliters completely changes the ratio of liquid to flour, which determines whether your cake rises or sits like a brick.
Precision matters, but the tool itself is imprecise.
Tire Pressure Recommendations Confuse Everyone

The sticker on your car’s door jamb shows one tire pressure number. The sidewall of your tire shows another, usually higher number.
People assume the tire sidewall gives the correct pressure. Wrong.
That higher number indicates the maximum pressure the tire can handle before exploding, not the optimal pressure for driving. The door jamb number reflects what the car manufacturer recommends for that specific vehicle’s weight and handling.
Using the tire’s maximum pressure makes for a harsh ride, uneven tire wear, and potentially dangerous handling. But people do it constantly because bigger numbers feel safer.
Eight Glasses of Water Makes No Sense

You’ve heard this so many times it sounds like a medical fact: drink eight 8-ounce glasses of water per day. That’s 64 ounces total, or about half a gallon.
But where did this come from? Nobody knows.
It doesn’t appear in any scientific research. Your actual water needs depend on your size, activity level, climate, diet, and health conditions. A 250-pound man running in summer heat needs dramatically more water than a 100-pound woman working at a desk in air conditioning.
You get water from food too. Fruits and vegetables are mostly water.
Coffee and tea count. That eight-glasses rule ignores all these variables and creates a one-size-fits-all recommendation that fits nobody.
Screen Time Hours Don’t Tell the Full Story
Parents panic about screen time and try to limit children to two hours per day, based on recommendations from pediatric associations. But not all screen time is equal.
Two hours of educational programming while sitting calmly differs completely from two hours of rapid-fire YouTube videos designed to trigger dopamine responses. An hour of video chatting with grandparents isn’t the same as an hour of doom-scrolling social media.
The time measurement captures quantity but misses quality entirely. Ten minutes of certain content can be more harmful than two hours of other content.
Yet the guidelines focus purely on clock hours because they’re easy to measure.
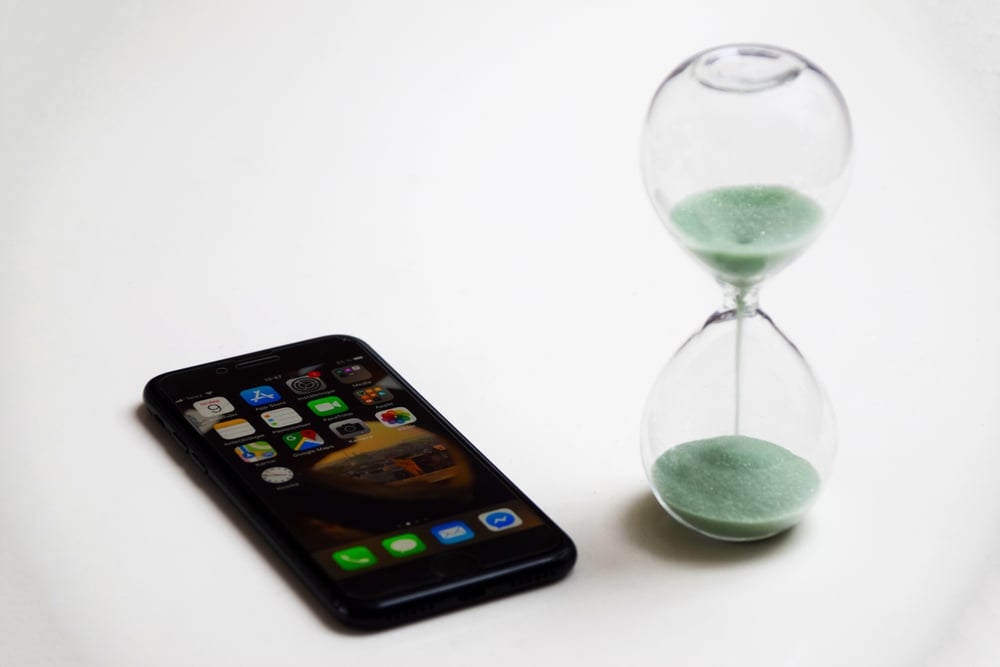
Sleep Cycles Don’t Always Last 90 Minutes

Sleep apps and fitness trackers tell you that sleep cycles last 90 minutes, so you should sleep in 90-minute increments for optimal rest. Seven and a half hours is better than eight hours, they claim, because you wake up at the end of a cycle instead of in the middle.
Real sleep cycles actually vary from 80 to 120 minutes and change throughout the night. Your first cycle is usually shorter.
Later cycles have more REM sleep. The 90-minute number is an average that doesn’t reflect any individual person’s actual pattern.
Waking up groggy has more to do with sleep quality and consistency than hitting some magical 90-minute window.
Calorie Counts on Labels Are Estimates
Food labels list calories down to the single digit, which creates an illusion of precision. The FDA allows a 20 percent margin of error on these labels.
A snack bar labeled as 200 calories can legally contain anywhere from 160 to 240 calories. Restaurants have even wider margins, and many chain restaurants underestimate their dishes by 20 to 30 percent.
Your body doesn’t absorb calories consistently either. How you cook food, how much you chew, your gut bacteria, your metabolic rate—all of these change how many calories you actually extract from that supposedly precise 200-calorie snack bar.
Thread Count Doesn’t Determine Sheet Quality
Higher thread count must mean better sheets, right? Not anymore. Manufacturers discovered they can game the system by counting multi-ply threads multiple times.
A two-ply thread counts as two threads, even though it’s one thread twisted together. So a sheet marketed as 1000-thread-count might actually be 500-thread-count using doubled threads.
After about 400 threads per inch, adding more threads doesn’t improve quality and often makes sheets less breathable. Thread quality, fiber length, and weave pattern matter more than raw thread count.
But thread count is easier to market because bigger numbers sell better.
SPF Ratings Create a False Hierarchy
SPF 15 blocks 93 percent of UVB rays. SPF 30 blocks 97 percent. SPF 50 blocks 98 percent. People assume SPF 50 provides substantially more protection than SPF 15, but you’re really looking at the difference between blocking 93 percent and 98 percent of rays.
That extra 5 percent matters less than applying enough sunscreen in the first place and reapplying it regularly. Most people use only 25 to 50 percent of the recommended amount of sunscreen.
Using half the recommended amount of SPF 50 gives you less protection than using the full amount of SPF 15. The number creates confidence that isn’t justified by actual application habits.
Decibel Scales Aren’t Linear
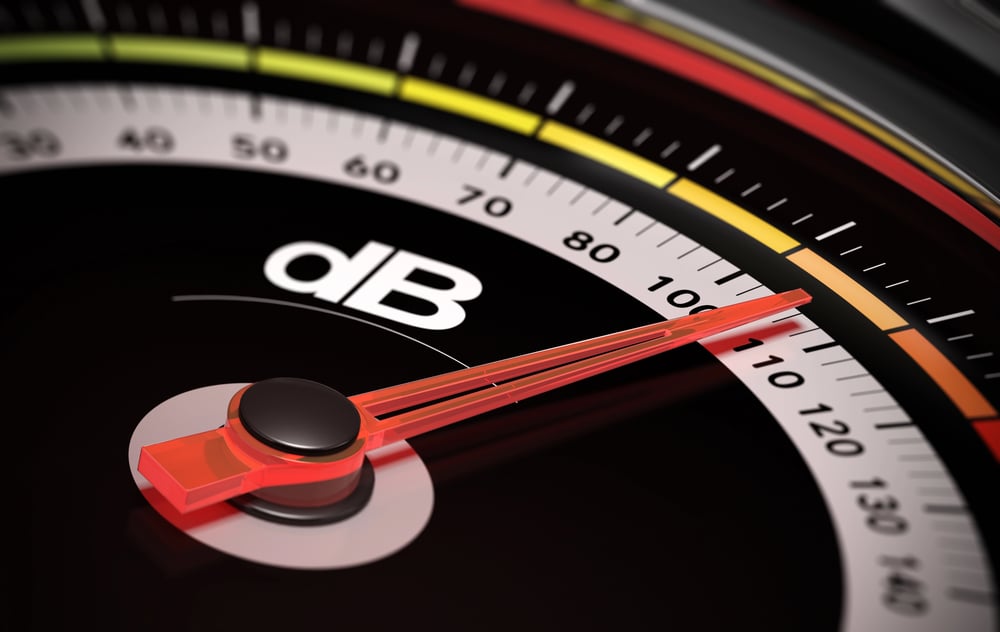
When something measures 60 decibels and another thing measures 120 decibels, that doesn’t mean the second is twice as loud. Decibels use a logarithmic scale.
An increase of 10 decibels represents a sound that’s perceived as twice as loud. So 120 decibels isn’t twice 60 decibels. It’s 64 times louder.
This explains why hearing protection becomes critical at certain thresholds. The jump from 100 to 110 decibels represents the same proportional increase as going from 20 to 30 decibels, but the damage potential is vastly different.
People see the numbers going up gradually and don’t grasp the exponential increase in actual intensity.
Distance You Walk Gets Distorted by Stride Length

Fitness trackers tally steps then turn them into miles using a typical step size. Since everyone’s legs are different, the real distance might not match what shows up on screen.
When someone short walks 10K steps, they’ve moved less than a tall person doing the same thing. So height changes how far you actually go – even if the number looks identical.
Some gadgets allow adjusting step size, yet hardly anyone does it. Instead, folks go with the gadget’s guess while measuring distance against buddies’ results – without noticing they’re mixing up mismatched measures thanks to different leg lengths.
When Numbers Stop Being Useful
Measurements make you feel sure when things seem unpredictable. Yet they often turn rough guesses into hard facts.
Instead of seeing patterns, we act like each number is perfect. These general results get used for one person, even though everyone’s different.
A single moment gets stretched to represent the whole story. You never quit checking stuff.
Life today needs that. Yet you could quit thinking those checks tell the full story.
That weight number, time on your watch, temp reading – each one’s only an opening clue, not the truth itself. Real life’s more tangled than numbers show, but that’s okay.
It simply is.
More from Go2Tutors!

- The Romanov Crown Jewels and Their Tragic Fate
- 13 Historical Mysteries That Science Still Can’t Solve
- Famous Hoaxes That Fooled the World for Years
- 15 Child Stars with Tragic Adult Lives
- 16 Famous Jewelry Pieces in History
Like Go2Tutors’s content? Follow us on MSN.